.svg)
Version 7.5.0
Release date: 5/5/20
Please note:
- The 7.4.0 technical-analysis-chart.html and basic-chart.html templates must be updated to work with the new 7.5.0 chart configuration file, sample-config.js.
- The chart CIQ.UI.Context object is now accessible globally as the
uiContextproperty of the chart engine instance.
See the 7.4.0 to 7.5.0 upgrade notes for information about upgrading to this version.
New features
-
Term Structure
-
Secondary curves — The Term Structure product can now display multiple curves on the same chart, enabling a clear comparison of curves from different dates and times (historical curves) or different sets of instruments (entity curves). Each curve can have its own distinctive color. A list of the curves is displayed in the familiar Plots drop-down list.
Historical curves
 Figure. Historical curves — Different dates and times for the same instruments.
Entity curves
 Figure. Entity curves — Different sets of instruments; for example, Canadian Treasury Bills vs. the U.S. Treasury Benchmark.
 -
Curve spreads — The difference in value between instruments on different curves and between instruments on the same curve is known as the spread. ChartIQ's Term Structure product provides a quick view of curve spreads in a tooltip-like display that can include multiple curves and multiple instruments.
 Figure. Curve spreads.
Note: The Term Structure product is available only in the Term Structure package or as an option in the Technical Analysis package.
-
New cq-historical-comparison-dialog web component adds secondary curves to a term structure chart. The secondary curves plot the instruments of the main curve using data from past dates.
-
New cq-curve-comparison web component enables the addition of secondary curves that plot instrument data for entities that are comparable to the chart's primary entity (such as the U.K. sovereign bond in comparison to the U.S. Treasury Benchmark).
-
New cq-curve-comparison-tap-capture surrounds
cq-menuandcq-comparison-lookup-framecomponents to handle the selection of items from menus and lookup dialog boxes that are part of a comparison control. The control enables the addition of secondary curves to a term structure chart. -
New
CIQ.ChartEngine#drawTermStructurePointsfunction draws the data points of a term structure curve, including the mouse-over highlighting and the highlighting that indicates a data point has been recently updated. -
New
CIQ.ChartEngine#drawTermStructureSpreadsfunction draws curve spreads on a term structure chart, including the guidelines between data points and the numeric values of the spreads. -
New
CIQ.TermStructure#deselectCurvePointsfunction deselects all data points that have been selected on a curve. Typically, data points are selected to show curve spreads. -
New
CIQ.TermStructure#addCurvefunction adds a secondary curve to the term structure chart. -
New
CIQ.TermStructure#removeCurvefunction removes a secondary curve from the term structure chart. -
New
CIQ.TermStructure#modifyCurvechanges the color of a curve. -
CIQ.TermStructure#setCurveDatefunction has added theparamsandparams.noRecordparameters. When true,noRecordprevents recording of the curve data. The parameter is set to true when importing curves (for example, when reloading the chart).
-
-
Hidden outliers
With the new hidden outliers feature, outliers are literally off the chart. By hiding outliers, charts can properly scale the y-axis to reveal the differences in the more statistically normal portion of the data series.
Visual markers indicate where outliers exist in the time series data. The markers indicate the position of both high and low outlier values. Selecting either type of marker reveals the full range of the upper or lower portion of the chart respectively.
Complementary controls, which also hide and show the outliers, appear at the top and bottom of the y-axis.
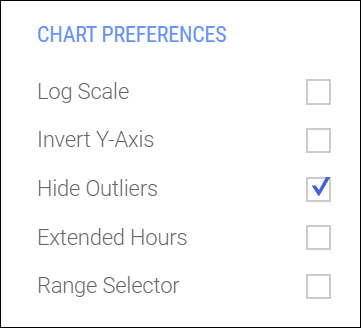
 Figure. Chart with hidden outliers.
The outlier feature is turned on and off from the CHART PREFERENCES section of the Display menu of the technical-analysis-chart.html template.
Note: The hidden outliers feature is an add-on available only in the Technical Analysis package.
-
New CIQ.Outliers constructor function creates the outliers add-on which scales the y-axis to the main trend, hiding any outlier values. See the API documentation for a complete list of the functions contained in this add-on.
-
New CIQ.UI.Layout#setOutliers convenience function toggles the outliers layout property between on and off (true and false). The method is invoked from the Display drop-down menu of the technical-analysis-chart.html template.
-
New CIQ.UI.Layout#getOutliers function sets the class of the UI control that shows and hides outliers, such as the Display menu
cq-itemin the technical-analysis-chart.html template. Setting the class marks the UI item as selected or cleared. -
New CIQ.ChartEngine#layout[`outliers`] property specifies whether outlier detection is enabled.
-
-
Clustered baseline histograms
Histograms of time series data can now display negative as well as positive values. You can add multiple series to a chart, set a baseline value, and even set the color, pattern, line width, and opacity of the baseline. Data points are displayed above or below the baseline as histogram bars. For example, if the baseline is 70, any time series values greater than 70 are graphed as bars above the baseline; values less than 70, bars below the baseline.
Clustered baseline charts provide a clear view of variation around a base value.
 Figure. Clustered baseline histogram.
- CIQ.Renderer.Histogram has added the ability to draw negative bars when the
yAxis.baselineparameter is set to zero or some other value (see the API documentation for examples).
- CIQ.Renderer.Histogram has added the ability to draw negative bars when the
-
React

The Elliott Wave drawing tool is now part of the React component toolkit. The new component enables chart users to identify and draw Elliott Waves on time series charts. A variety of configuration settings and style options make the Elliott Wave tool exceptionally customizable. And now, React developers can easily include this powerful drawing tool in their React charting applications.
-
Angular

The new Angular component toolkit enables you to easily add charts to your Angular applications. You can create a complete charting solution using just a single component:
AdvancedChartComponentis the Angular equivalent of ChartIQ's technical-analysis-chart.html charting implementation. WithAdvancedChartComponent, you can add advanced charting to your Angular applications, including add-ons and plug-ins, in a few simple steps.See the chartiq-angular-app for an example implementation of
AdvancedChartComponent. -
Android

Android developers can now access the data in the heads-up display (HUD), which contains information about the data point at the crosshairs location.
- New
getHudDetails()function in theNativeLibraryBridgenamespace gathers and returns the heads-up display data based on cursor position.
- New
-
Web components

The ChartIQ W3C-standard web components have been redesigned to make them fully compatible with all major JavaScript component frameworks, including Angular and React. The web components have been fully encapsulated to ensure consistent behavior and reliability. Component communication is managed by means of a new publish/subscribe messaging model.
The rearchitected web components form the foundation of the new Angular component toolkit. They also make the ChartIQ templates, such as technical-analysis-chart.html and basic-chart.html, an even better choice for customers who want a quick and easy but full-featured charting solution.
Note: The 7.4.0 technical-analysis-chart.html and basic-chart.html templates must be updated to work with the new web components. Please see the 7.4.0 to 7.5.0 upgrade notes.
-
New cq-abstract-marker component encapsulates a complex marker which can contain HTML, video, images, CSS, and animations.
-
New cq-chart-legend component creates the chart (or study) legend which shows the list of active comparisons or studies.
-
New cq-comparison-lookup component creates the comparison lookup control, + Compare...
-
New cq-info-toggle component provides toggle management for the three-state heads up display.
-
New cq-menu-container component creates a menu based on the value of the
cq-nameattribute. -
New cq-side-nav component responds to the
breakpointandsidenavchannels to control side navigation panel availability. -
New CIQ.UI.addComponentDefinition function adds a web component definition to the list of web components.
-
New CIQ.UI.registerComponents function registers components added with CIQ.UI.addComponentDefinition.
-
New CIQ.UI.ensureComponentsRegistered function ensures that all web components in the web component list have been registered.
-
New CIQ.UI.componentMarkup serves as a getter and setter for component markup.
-
New CIQ.UI.BaseComponent#addDefaultMarkup function adds default markup to a web component if the component does not have any child nodes.
-
New CIQ.UI.BaseComponent#channelWrite function writes in the chart engine communication channel.
-
New CIQ.UI.BaseComponent#channelRead function reads the current value in the chart engine communication channel.
-
New CIQ.UI.BaseComponent#channelMergeObject function merges an object in the chart engine communication channel.
-
New CIQ.UI.BaseComponent#channelSubscribe function subscribes to the chart engine messaging channel.
-
New CIQ.UI.BaseComponent#qs function adapts the querySelector method.
-
New CIQ.UI.BaseComponent#qsa function adapts the querySelectorAll method.
-
New CIQ.UI.BaseComponent#getContextContainer function searches the DOM for a chart context element. Searches from a provided element and proceeds up the ancestry tree until an element is found or the root of the tree has been reached.
-
New CIQ.UI.BaseComponent#getChartContainer function searches the DOM for the chart container element. Begins the search from a provided element and proceeds parent-by-parent up the ancestry tree until an element is found.
-
New CIQ.UI.BaseComponent.selfOrParentElement function searches the DOM for an element that has a specified CSS class, HTML attribute, or tag name. Begins the search at a starting element and proceeds up the ancestry tree until an element is found or the root of the tree has been reached.
-
New CIQ.UI.BaseComponent.toPropAndObject function walks an object path by means of the elements of a specified path.
-
New CIQ.UI.BaseComponent.getChannel function retrieves a channel object and property from a given path.
-
New CIQ.UI.getUIManager function obtains a reference to the document's cq-ui-manager instance or, if one does not exist, creates an instance.
-
New CIQ.UI.Chart class contains a collection of methods used to instantiate and configure charts and the chart user interface.
-
New CIQ.UI.Chart#createChart function creates the chart engine, attaches quote feeds, and initiates add-ons and the L2 simulation.
-
New CIQ.UI.Chart#createChartAndUI function creates the chart engine and user interface, including the UI context.
-
New CIQ.UI.Chart#initContainerListeners function initializes the chart container size change listener, channel subscriptions, and the keystroke hub and its focus management.
-
New CIQ.UI.Chart#initLookup function creates a symbol change filter and attaches it to the chart UI context and lookup containers.
-
New CIQ.UI.Chart#initKeystrokeHub function attaches a CIQ.UI.KeystrokeHub to the
bodyelement to enable users to start typing anywhere on the page to activate the chart's symbol input box. -
New CIQ.UI.Chart#getKeystrokeHubSetter function gets a callback that sets the active context of the keystroke hub based on the mouse pointer location.
-
New CIQ.UI.Chart#initDialogHandler function subscribes to the dialog channel.
-
New CIQ.UI.Chart#initDrawingTools function subscribes to the drawing channel to manage drawing tool visibility based on channel messages.
-
New CIQ.UI.Chart#initDrawingEditListeners function creates a CIQ.UI.DrawingEdit helper and adds listeners to the helper. The listeners post messages in the drawing channel when drawing starts and ends.
-
New CIQ.UI.Chart#initColorPicker function creates and appends a cq-color-picker component to the document body if one is not already attached.
-
New CIQ.UI.Chart#loadChart function loads a chart with an initial symbol.
-
New CIQ.UI.Chart#notifySizeChanges event handler for chart container size changes.
-
New CIQ.UI.Chart#getBreakpoint function maps numeric widths to responsive break types.
-
New CIQ.UI.Chart#initEventMarkers function initiates event marker functionality.
-
New CIQ.UI.Chart#initExtensions function installs add-ons and plug-ins.
-
New CIQ.UI.Chart#initStorage function initiates the storing of state on state changes.
-
New CIQ.UI.Chart#getSaveLayout function captures configuration information in a returned callback function.
-
New CIQ.UI.Chart#restoreLayout function restores the chart layout.
-
New CIQ.UI.Chart#getSaveDrawings function captures configuration information to provide to the callback that saves the state of chart drawings.
-
New CIQ.UI.Chart#restoreDrawings function restores the state of saved chart drawings.
-
New CIQ.UI.Chart#savePreferences function saves the chart preferences.
-
New CIQ.UI.Chart#restorePreferences function restores the chart preferences.
-
New CIQ.UI.Chart#retoggleEvents utility function synchronizes marker state.
-
New CIQ.UI.Chart#chartPositionSetter function returns a setter function that updates the size of the side navigation panel by positioning the chart container
div. -
New CIQ.UI.Chart#sidenavSizeSetter function returns a setter that updates the width of the side navigation panel by positioning the chart area.
-
New CIQ.UI.Chart#chartAreaTopSetter function returns a setter that updates the top position of the chart area.
-
New CIQ.UI.Chart#sidepanelSizeSetter function returns a setter that updates the width of the side panel by setting the right position of the chart area.
-
New CIQ.UI.Chart#breakpointSetter function returns a setter that updates the responsive break point of the top node of the chart user interface context.
-
Other enhancements
-
New CIQ.ChartEngine#getPeriodicity function returns the periodicity of the chart. The values returned for
period,interval, andtimeUnitare converted from their internal format to the format specified by CIQ.ChartEngine~PeriodicityParameters and required by the CIQ.ChartEngine#setPeriodicity function and CIQ.ChartEngine#loadChart function. -
New sample-config.js file contains all of the chart default configuration information that was formerly in sample-template.js, making sample-template.js simpler and more concise. By returning a configuration object through its
getDefaultConfigfunction, sample-config.js empowers CIQ.UI.Chart#createChartAndUI to perform much of the work previously done by sample-template.js, which simplifies framework integration. -
The technical-analysis-chart.html and basic-chart.html templates have been significantly simplified thanks to the new, rearchitected web components. All DOM generation now takes place in the web component, but if a template is needed, the web component can inject that as well (as in previous versions).