.svg)
Version 8.0.0
Release date: 8/5/20
BREAKING CHANGES
- All version 7.5.0 charting templates must be updated to work with the new ES6 modules. Please see the 7.5.0 to 8.0.0 upgrade notes.
- A
file:///URI can no longer be used to load the sample template files or any other HTML file that imports library modules. The library's ES6 modules must be loaded using HTTP or HTTPS to prevent CORS (cross-origin resource sharing) errors. ES6 requires special HTTP headers that provide enhanced security for cross-origin requests. As a result, double‑clicking or double‑tapping library HTML files to load them no longer works. - The
CIQ.UI.Chart#initStoragefunction has been removed from the library. - The
CIQ.UI.Layout#getOutliersfunction is no longer public.
New features
-
ES6 modules — The library now consists entirely of ES6 modules, enabling you to create custom module bundles. Sample webpack templates (in the library root folder) demonstrate how to tree shake the library and remove any unneeded dependencies.
See the 7.5.0 to 8.0.0 upgrade notes for more information.
- New CIQ.activateImports function is called to activate imports for use by the API. If an import is not activated, its code is inaccessible and may be tree shaken by bundlers. The function keeps track of which imports have been activated already so no import gets added more than once.
-
Projected volume studies
Projected Volume at Time — Projected Volume at Time (PVAT) is an average of intraday trading volume for a given time segment. The study enables traders to evaluate during the trading day whether today's volume is above or below average and see projected volume for the remainder of the day. A bar graph shows the volume at each periodicity interval (candle); an overlay line shows the average volume for each time segment. When the current volume exceeds the PVAT average by a customizable percentage, the color of the volume bar in the bar graph changes to a customizable color, alerting the user.
 Figure. PVAT study showing trading volume bar graph, alert bars, and moving average line.
Projected Aggregate Volume — Projected Aggregate Volume (PAV) is an aggregation of the day's trading volume up to the current time along with a projection of the aggregate volume for the remainder of the trading day. The study reveals whether the trend in trading volume is above or below average and provides a forecast of volume for the rest of the day.
 Figure. PAV study showing aggregated trading volume bar graph and moving average line.
-
New CIQ.Studies.calculateProjectedVolume function calculates the projections and aggregations for the Projected Volume at Time (PVAT) and Projected Aggregate Volume (PAV) studies.
-
New CIQ.Studies.displayProjectedVolume function displays the Projected Volume at Time (PVAT) and Projected Aggregate Volume (PAV) studies.
-
New CIQ.Studies.validateProjectedVolumeLookback function determines whether a projected volume lookback period is valid for the currently selected periodicity. Setting the lookback too high results in the chart attempting to load more data than is allowed by CIQ.ChartEngine#maxDataSetSize.
-
-
Enhanced Life Cycle Events
Event zoom — Enables users to double click to zoom in from a broad periodicity to a finer level of detail to see more granular data, then zoom back out.
 Figure. Life cycle events at default periodicity.
 Figure. Zoomed-in view of a life cycle event.
-
New CIQ.Marker.TimeSpanEvent#doubleClick function toggles the event zoom of a time span event marker.
-
New CIQ.Marker.TimeSpanEvent#toggleEventZoom function zooms and un-zooms the display of the time span event marker's date range.
-
New CIQ.TimeSpanEventPanel#alwaysZoom property when true enables event zoom on any time span event regardless of whether the event has sub-children.
Optimized panel height — The panel now adjusts for the number of swim lanes displayed.
 Figure. Life Cycle Events panel sized to fit one swim lane.
-
New CIQ.TimeSpanEventPanel#calculatePanelHeight helper function dynamically calculates the height of the time span events panel based on the number of swim lanes.
-
New CIQ.TimeSpanEventPanel#checkSetPanelHeight helper function checks and sets the required height of the time span events panel.
-
New CIQ.TimeSpanEventPanel#calculateSpacingModifier helper function calculates the
spacingModifierfor a swim lane (see thespanEventparameters of CIQ.TimeSpanEventPanel#renderTimeSpanEvent).
Event details from the swim lane — Hovering the mouse over a single event or duration event displays a tooltip containing the event headline. Selecting an event marker shows the event headline and story in a pop-up display.
 Figure. Life cycle event with tooltip and pop-up display.
-
New CIQ.TimeSpanEventPanel#createEventDetailPanel function creates a pop-up display when a time span event marker is selected.
-
New CIQ.TimeSpanEventPanel#showEventDetail function sets the position and shows or hides the pop-up display for a time span event marker.
-
New CIQ.Marker.TimeSpanEvent#positionTooltip function positions the event marker's tooltip node.
Easier customization
-
The constants.js file in the plugins/timespanevent folder now contains all configurable constants.
-
The timespanevent.js file in the plugins/timespanevent folder is no longer obfuscated. The file contains customizable functionality for displaying life cycle events.
-
-
Term Structure
Term structure charts can now display curves for multiple entities when the entities don't share the same set of instruments. For example, the U.S. Treasury yield curve contains maturities (instruments) of 1, 2, 3, and 6 months, but the yield curve of other sovereign bonds may not contain these short-term maturities. Term Structure lets you compare the curves just the same (if the entities have at least one instrument in common).
 Figure. Term structure chart comparing entities with varying instrument sets.
- New
CIQ.TermStructure.sortInstrumentsfunction sorts term structure instruments by their names.
- New
-
Hidden outliers
In study panels — Outliers can now be hidden in study panels. When a chart has outliers, studies associated with the chart may have outliers too. Now, study outliers can be hidden, replaced by markers that indicate the outlier location and value, making the study data trend clear. The markers can be selected to reveal the outliers. Controls at the top and bottom of the study's y-axis also show and hide the outliers.
 Figure. Momentum Indicator study with hidden outliers.
On multiple y-axes — Hidden outliers are supported on multiple y-axes; for example, when a comparison series has been added to a chart. The outliers for each series can be shown and hidden independently using the outlier controls on the respective y-axis.
 Figure. Chart with comparison series and hidden outliers.
-
New CIQ.Outliers#processDataSet function checks for outlier values and adds outlier markers (data point markers and axis markers) to a chart or study.
-
New CIQ.Outliers#refreshMarkerArray function updates the freshness status of outlier markers.
-
New CIQ.Outliers#refreshMarkers function updates the display styles of all outlier markers, including data point markers and axis markers.
-
New CIQ.Outliers#handleMarkerClick function calls CIQ.Outliers#setDisplayState in response to selecting an outlier marker.
-
New CIQ.Outliers#setMarkerColor function applies a background color to an outlier data point marker.
-
New CIQ.Outliers#flipMarkers function repositions outlier markers from the top of the display to the bottom (or vice versa) when the associated y-axis has been flipped (inverted).
-
-
Preferences menu
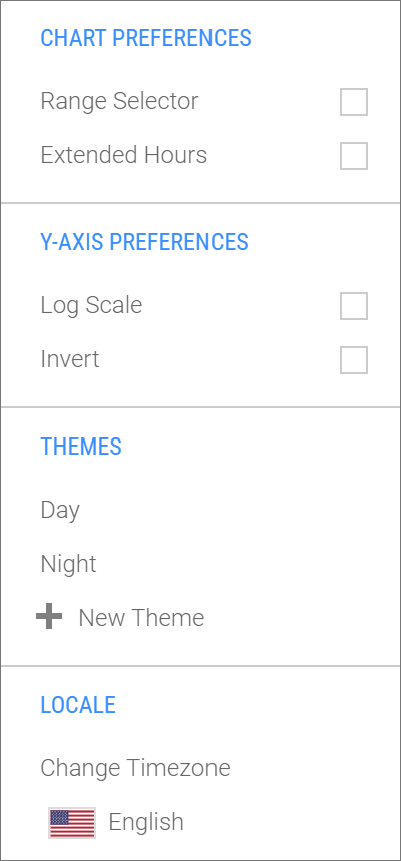 In the technical-analysis-chart.html and sample-template-advanced.html templates, the CHART PREFERENCES, Y-AXIS PREFERENCES, THEMES, and LOCALE sections of the Display menu have been moved to a new preferences menu, which is opened and closed by a cog wheel control
  .
.
See the following markup in the templates:
<cq-menu class="ciq-menu ciq-preferences collapse">
    <span></span>
    <cq-menu-dropdown>
    .
    .
    .
On mobile devices, the cog wheel on the left toolbar has been changed to a vertical ellipsis.
The Display menu is now limited to showing chart types.
-
Angular

The Angular component toolkit provides developers with a variety of complete charting solutions that can be easily incorporated into Angular applications. The charting application components are the equivalent of some of ChartIQ's most popular sample templates. New additions include:
- MultiChartComponent — Displays two advanced charts on screen simultaneously like sample-template-multi-charts.html.
- ActiveTraderComponent — Creates an information-rich desktop for cryptocurrency traders and other active traders; equivalent to active-trader-chart.html.
- CustomChartComponent — Integrates native Angular components with ChartIQ W3C-standard web components; technical-analysis-chart.html plus Angular.
The Angular seed project has been updated with the ES6 modularization changes.
-
React

The React app and seed projects have been updated with the ES6 modularization changes.
UI enhancements
-
CIQ.ChartEngine.preferences.whitespace — The whitespace between the most recent data point (candle) and the right side of the chart is now preserved as new data points are created. In the previous version of the library, the chart removed the whitespace when new candles appeared. See the Range and Span tutorial for more information.
-
New CIQ.ChartEngine#doubleClick handles all double-clicks on the chart container. Applies a double-click event to a CIQ.Marker and dispatches the
doubleClickevent, which invokes the doubleClickEventListener. -
New doubleClickEventListener callback function is called by CIQ.ChartEngine#doubleClick when the chart is quickly clicked or tapped twice.
-
New CIQ.ChartEngine#doubleClickTime property sets the maximum number of milliseconds between clicks that trigger a double-click.
-
New CIQ.Marker#doubleClick function called when a marker node is double-clicked. Override this function with your own implementation to prevent CIQ.ChartEngine#doubleClick from dispatching the
doubleClickevent and invoking the doubleClickEventListener. -
CIQ.ChartEngine.AdvancedInjectable#touchDoubleClick function no longer deletes overlays, series, or drawings or returns the chart to home when the user taps an axis.
-
CIQ.Marker.Performance constructor added the following parameters to better position and display markers:
params.infoOnLeft,params.infoOffset, andparams.invert. -
CIQ.Marker.Performance#calculateYPosition function added the
params.invertedparameter to enable proper calculation of the vertical position of markers when the marker stem is inverted.
Chart engine enhancements
-
New CIQ.ChartEngine.create function creates the chart engine, attaches quote feeds, initializes add-ons, adds event listeners, and loads the chart. Renamed from
CIQ.UI.Chart#createChart. -
New CIQ.ChartEngine.getSaveLayout function returns a callback function that saves chart layout information. Renamed from
CIQ.UI.Chart#getSaveLayout. -
New CIQ.ChartEngine.restoreLayout function restores the chart layout. Renamed from
CIQ.UI.Chart#restoreLayout. -
New CIQ.ChartEngine.getSaveDrawings function returns a callback function that saves the state of chart drawings. Renamed from
CIQ.UI.Chart#getSaveDrawings. -
New CIQ.ChartEngine.restoreDrawings function restores the state of saved chart drawings. Renamed from
CIQ.UI.Chart#restoreDrawings. -
New CIQ.ChartEngine.getSavePreferences function returns a callback function that saves the chart preferences. Renamed from
CIQ.UI.Chart#savePreferences. -
New CIQ.ChartEngine.restorePreferences function restores the chart preferences. Renamed from
CIQ.UI.Chart#restorePreferences. -
New CIQ.ChartEngine.getRetoggleEvents function returns a callback function that restores the state of the chart markers. Renamed from
CIQ.UI.Chart#retoggleEvents.
Data management enhancements
-
The newChartEventListener callback function has added the
upToDateparameter, which is true if quotefeed~dataCallback reports that no more future data is available. -
The quotefeed~dataCallback callback function has added the
upToDateparameter, which you should set to true to stop forward pagination requests if you know that no newer data is available.
Notification enhancements
-
New CIQ.ChartEngine.htmlControls.notificationTray holds notifications displayed by the chart.
-
New CIQ.ChartEngine#displayNotification function adds a message to the chart. Creates a
divcontaining a text message. Appends thedivto the CIQ.ChartEngine.htmlControls.notificationTray. -
New CIQ.ChartEngine#removeNotification function removes a notification from the CIQ.ChartEngine.htmlControls.notificationTray.
Panel enhancements
-
New CIQ.ChartEngine#setPanelHeight function changes the height of a panel, adjusting other panels accordingly.
-
New CIQ.ChartEngine.Panel#exportable property determines whether the panel is included in the CIQ.ChartEngine#exportLayout return object.
-
New CIQ.ChartEngine#isPanelAboveChart function determines whether a panel precedes the main chart in the display order.
Studies enhancements
- New CIQ.Studies.getMarketOffset function gets the difference between the local browser time and the market time.
Web component enhancements
-
New CIQ.UI.components function gets an array of components from the list of registered components. The array elements contain the tag, name, registration status, and markup of the matched components.
-
New CIQ.UI.markupDependencies function returns the dependencies of all web components based on the component markup.
Plug-ins enhancements
-
The following folders in the plugins folder have been renamed:
Old name New name tradingcentral analystviews recognia technicalinsights cryptoiq activetrader -
New CIQ.ChartEngine.pluginBasePath property sets the default base path for plug-ins.
-
New CIQ.VisualEarnings constructor function adds an instance of the Visual Earnings plug-in to the chart and creates the Visual Earnings drop-down menu.
-
New CIQ.UI.VisualEarnings helper function is available for managing the Visual Earnings plug-in.
Range slider enhancements
- New CIQ.RangeSlider#updateStyles function dynamically updates the styling of the range slider.
Other enhancements
-
New CIQ.getFromNS function accesses a property, method, or array in a namespace.
-
New CIQ.getFnFromNS function is a curried version of CIQ.getFromNS expecting a function to be returned.
-
New CIQ.get function is a curried version of CIQ.getFromNS expecting the namespace to be CIQ.
-
New CIQ.getFn function is a curried version of CIQ.getFromNS expecting the namespace to be CIQ and a function to be returned.
-
New CIQ.hhmm function converts a JavaScript
Dateobject to hh:mm format. -
New CIQ.ChartEngine.Chart#calculateTradingDecimalPlaces function replaces CIQ.ChartEngine.callbacks[`calculateTradingDecimalPlaces`].
-
New CIQ.addInternalStylesheet function adds style content to a document if it has not been added already.
-
CIQ.alert function now outputs the message to the console log if the window object does not exist.
-
CIQ.loadScript function has added the
isModuleparameter.